
Via Analytics Waste Management Platform to Increase Diversion and Lower Costs
Unlock the value of waste data to Advance waste performance Improvement programs
Improve sustainability and increase diversion with a complete view of your waste and recycling data.
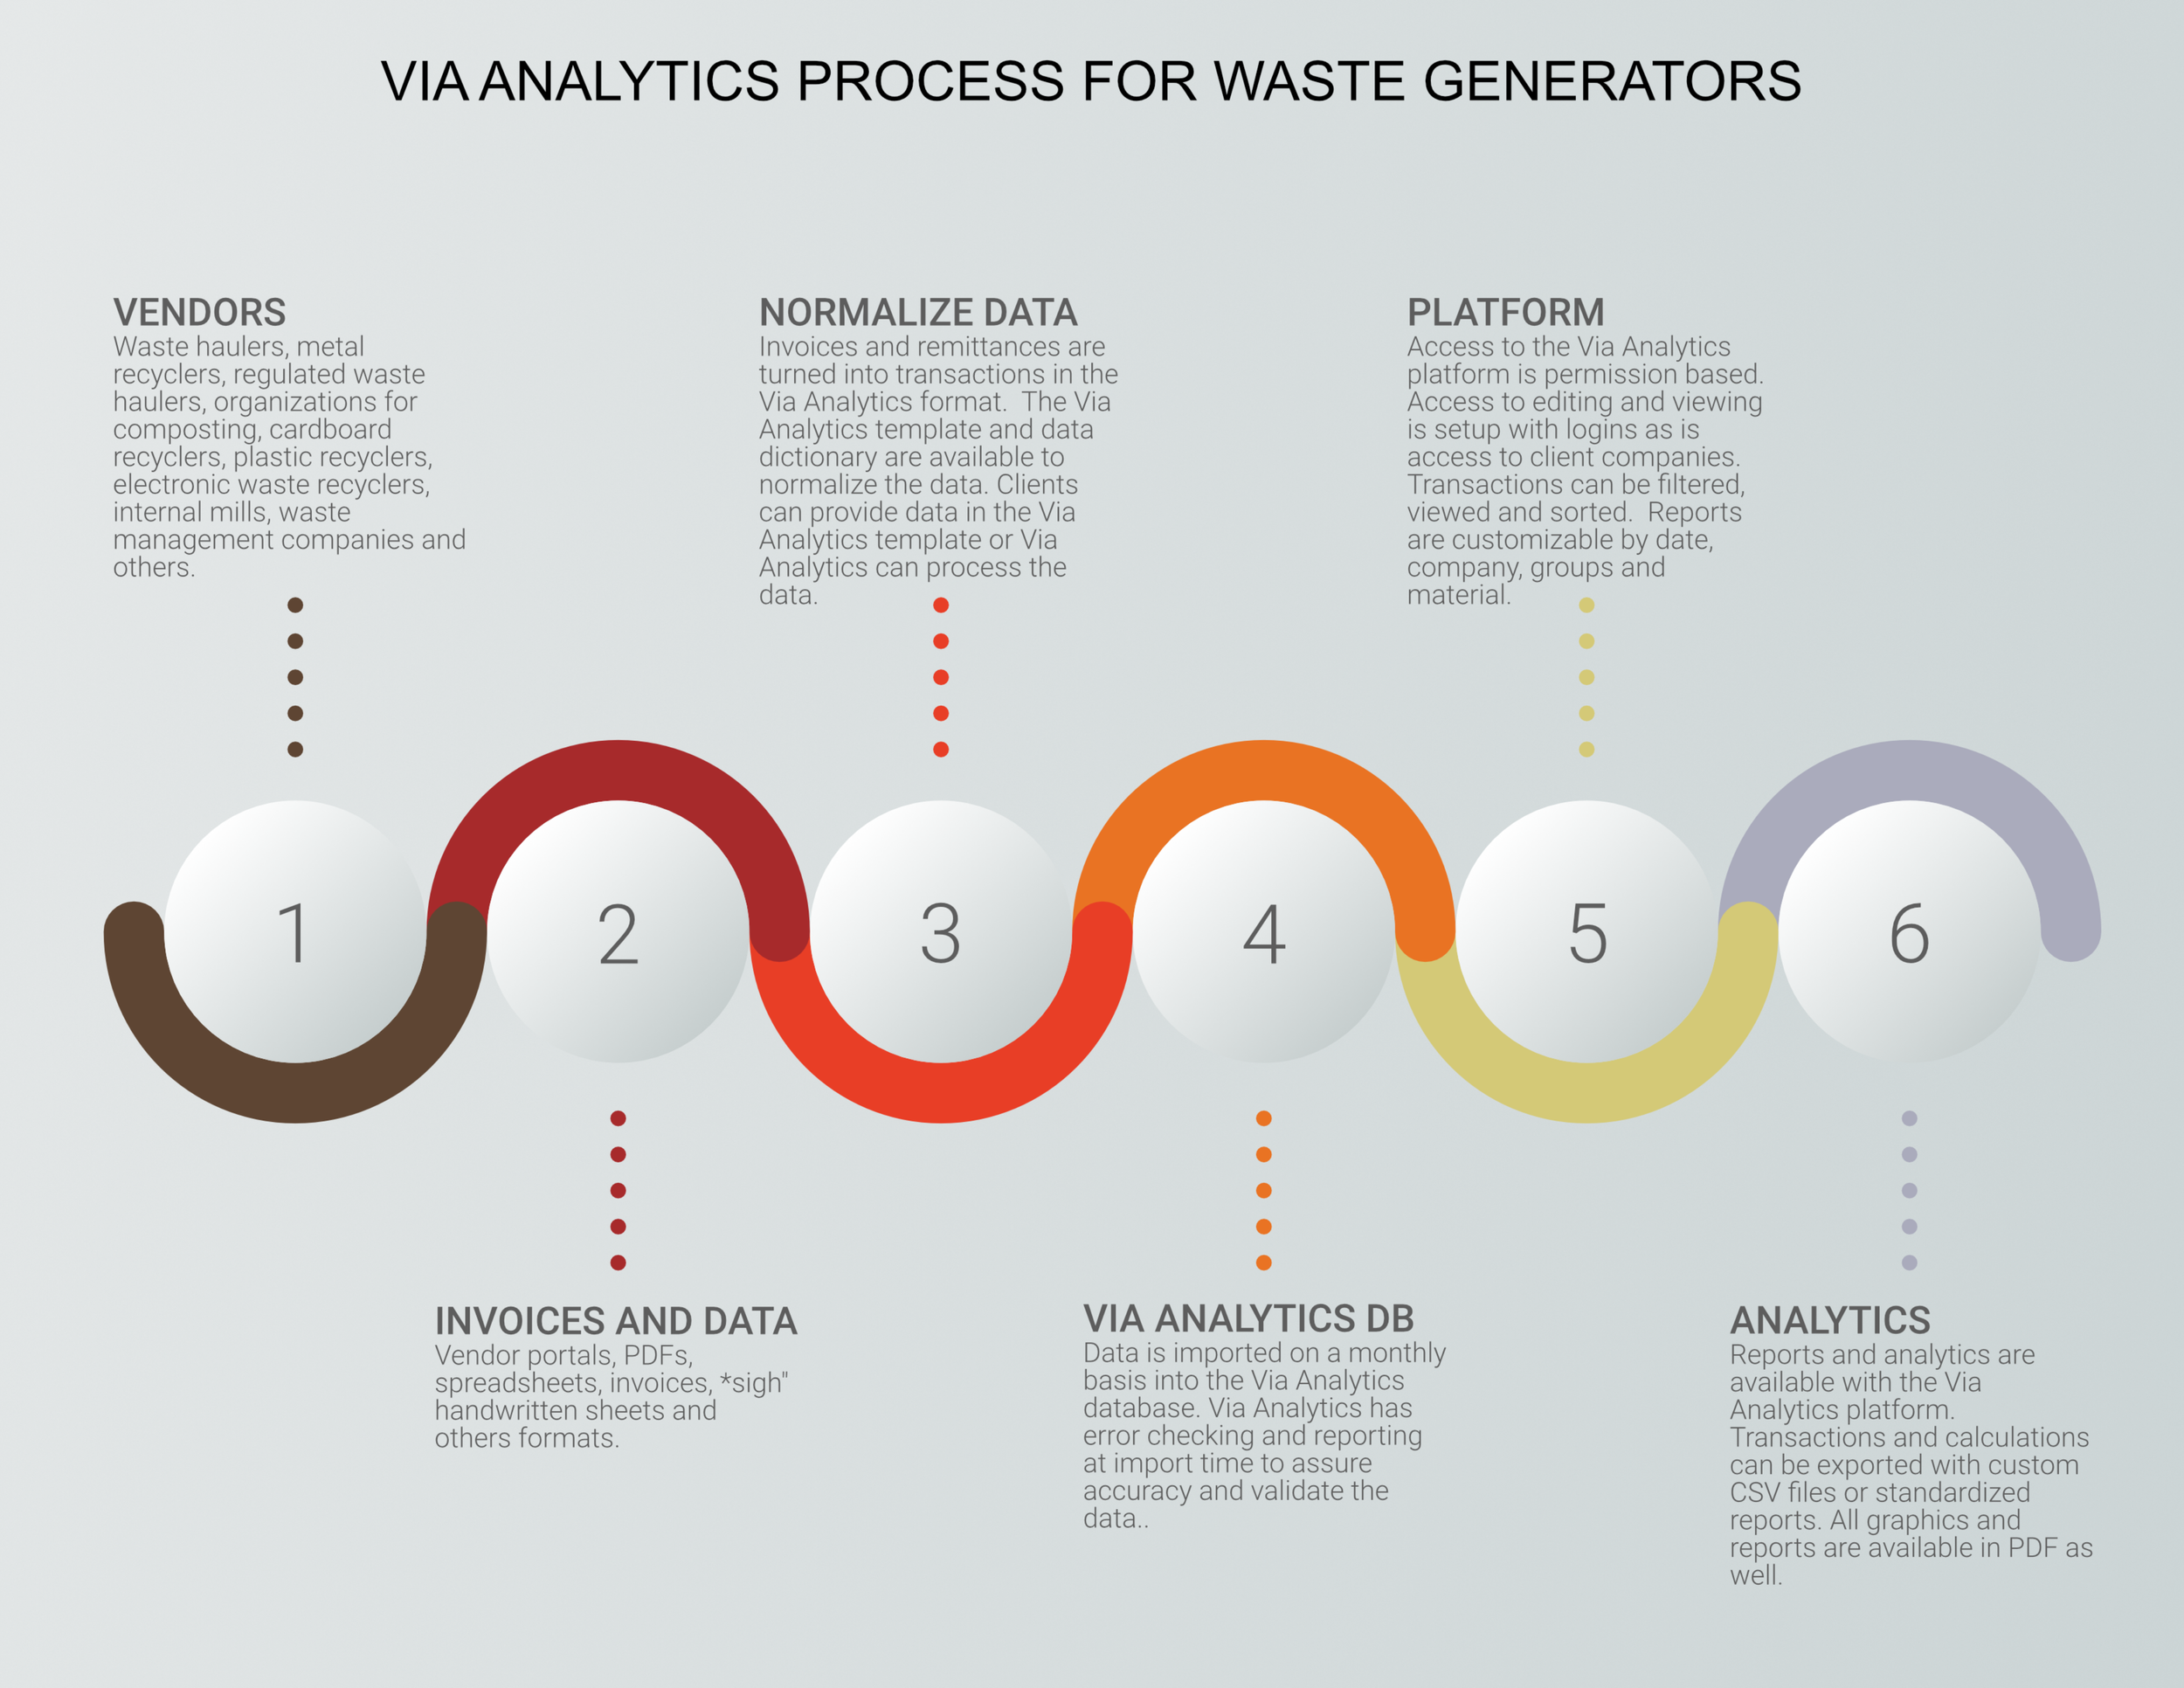
Via Analytics is a data analytics platform that solves the challenges associated with multiple vendors serving one or many locations. Through dashboards, detail reports and actionable insights, our clients have a complete view of their waste and recycling data allowing them to improve diversion rates and lower costs. The data can be analyzed to understand diversion, waste costs and support RFPs when required. And, progress can easily be shared both internally and externally.

TRUSTED PLATFORM FOR IMPACT
Organization gains accurate and valuable insights—including diversion rates for all locations. Centrally manage waste and recycling costs, rebates and diversion.

VERIFIABLE AND AUDITABLE RESULTS
Accurate, transaction data that is verified by an independent, 3rd party. EPA based calculations for environmental and GHG accounting.

DATA DRIVEN INSIGHTS
Dynamic dashboards to monitor progress and engage stakeholders. Share presentation level graphics, detailed financial reports, diversion rate rankings and spreadsheet exports and more

VISIBILITY FOR TEAMS
Location and material based dashboards and reports for teams to see their contribution to the overall organization's sustainability goals.

ONE PLATFORM TO UNLOCK THE VALUE OF WASTE DATA
WASTE, RECYCLING, REUSED AND DONATED DATA IN ONE PLACE
All waste data for the organization in one place. Waste, recycling, reused and donated materials stored at the transaction level with weights and accounting data. High level reports and a dashboard to monitor diversion rates and costs. Year-end sustainability reporting, charts, reports and spreadsheet exporting for sharing success with stakeholders. Actionable results for collaboration and central management or facility-based discovery.

UNTIL VIA ANALYTICS MEASURING WASTE DATA HAS NOT BEEN EASY.

MULTIPLE WASTE ORGANIZATIONS
AND MANY DATA TYPES
There are regulated waste companies, local composters, cardboard recyclers, solid waste haulers, metal recyclers, pallet recyclers and more. Some companies have their internal mills that hold the data and some materials go back to the manufacturer. Each organization has their own data types and format–some data is available in a spreadsheet and sometimes it is only available on a paper invoice, but it all counts for calculating diversion.

MANY FACILITIES AND SOME FACILITIES HAVE MULTIPLE VENDORS
Managing waste and recycling data for several locations with a spreadsheet might be doable at the end of the year, but having metrics, graphics and monthly reporting is a challenge when different teams need to review aspects of the data that reveal a variety of insights. What is the company’s overall diversion rate this month and cost? What were our rebates? How do facility’s with best practices compare to others? How has the increased diversion effected our costs? Can we see that in a pie chart and a line graph for the past 4 years or how about a doughnut chart?


GET STARTED WITH VIA ANALYTICS AND UNLOCK THE VALUE OF YOUR WASTE DATA TODAY!